
Dears, when I start my ABP MVC project on debugger (using Jetbrains Rider) it takes 22 seconds to start and move from OpenIddict to webhost started.
2024-02-26 10:37:06.361 +01:00 [INF] - Volo.Abp.LanguageManagement.LanguageManagementWebModule
2024-02-26 10:37:06.361 +01:00 [INF] - Volo.Abp.AspNetCore.Mvc.UI.Theme.LeptonX.AbpAspNetCoreMvcUiLeptonXThemeModule
2024-02-26 10:37:06.361 +01:00 [INF] - Volo.Abp.LeptonX.Shared.AbpAspNetCoreLeptonXSharedModule
2024-02-26 10:37:06.361 +01:00 [INF] - Volo.Abp.AspNetCore.Mvc.UI.MultiTenancy.AbpAspNetCoreMvcUiMultiTenancyModule
2024-02-26 10:37:06.361 +01:00 [INF] - Volo.Abp.TextTemplateManagement.Web.TextTemplateManagementWebModule
2024-02-26 10:37:06.361 +01:00 [INF] - Volo.Abp.Gdpr.Web.AbpGdprWebModule
2024-02-26 10:37:06.361 +01:00 [INF] - Volo.Abp.Swashbuckle.AbpSwashbuckleModule
2024-02-26 10:37:06.361 +01:00 [INF] - Volo.Abp.AspNetCore.Serilog.AbpAspNetCoreSerilogModule
2024-02-26 10:37:06.434 +01:00 [DBG] Started background worker: Volo.Abp.BackgroundJobs.BackgroundJobWorker
2024-02-26 10:37:06.441 +01:00 [DBG] Started background worker: Volo.Abp.OpenIddict.Tokens.TokenCleanupBackgroundWorker
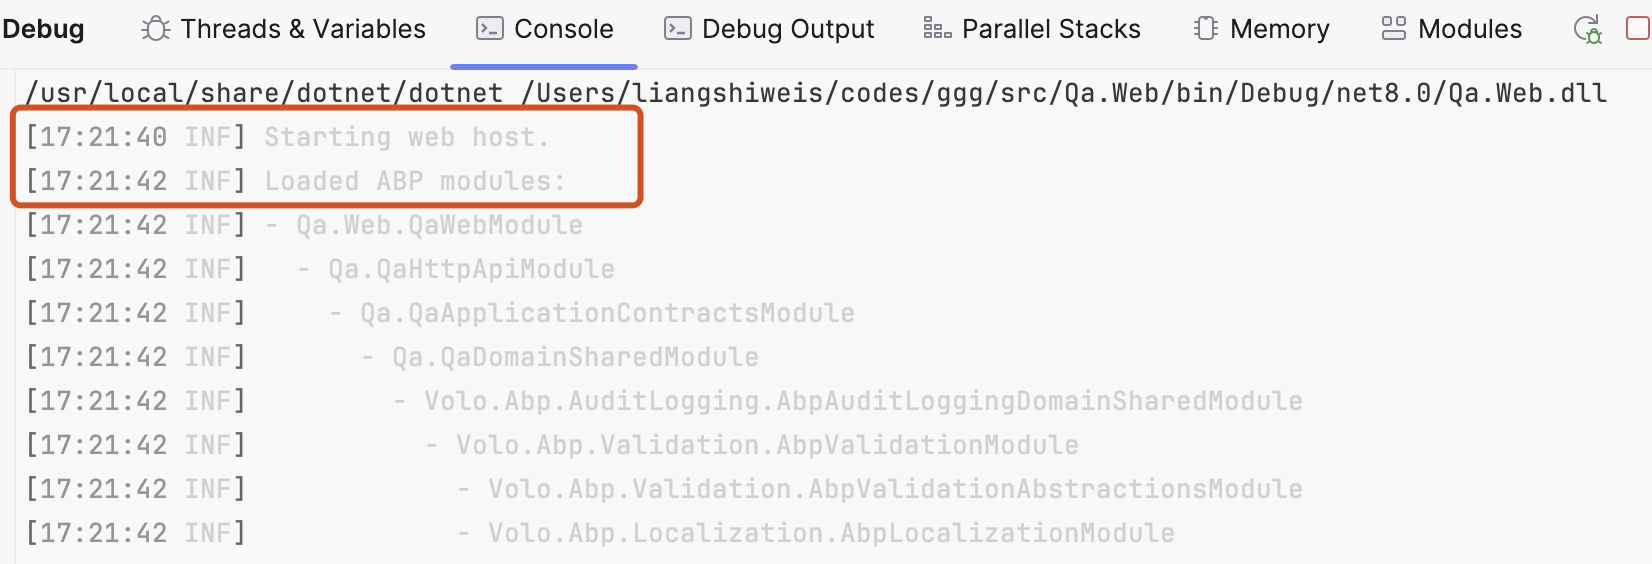
2024-02-26 10:38:28.240 +01:00 [INF] Starting web host.
2024-02-26 10:38:29.243 +01:00 [INF] Loaded ABP modules:
2024-02-26 10:38:29.243 +01:00 [INF] - MasterMVC.Web.MasterMVCWebModule
2024-02-26 10:38:29.243 +01:00 [INF] - MasterMVC.MasterMVCHttpApiModule
2024-02-26 10:38:29.243 +01:00 [INF] - MasterMVC.MasterMVCApplicationContractsModule
2024-02-26 10:38:29.243 +01:00 [INF] - MasterMVC.MasterMVCDomainSharedModule
2024-02-26 10:38:29.243 +01:00 [INF] - Volo.Abp.AuditLogging.AbpAuditLoggingDomainSharedModule
2024-02-26 10:38:29.243 +01:00 [INF] - Volo.Abp.Validation.AbpValidationModule
Have you any suggestion to improve startup time?
Many thanks
- ABP Framework version: 8.10.rc1
- UI Type:MVC
- Database System: EF Core (SQL Server)
- Tiered (for MVC) or Auth Server Separated (for Angular): yes
- Exception message and full stack trace: see piece of log.txt from "Solution".Web project
- Steps to reproduce the issue:
10 Answer(s)
-
0
I think this has nothing to do with ABP; when I debug the project using Rider it's fast
-
0
May I ask you which is your startup time in Rider?
Thanks
-
0
Hi,
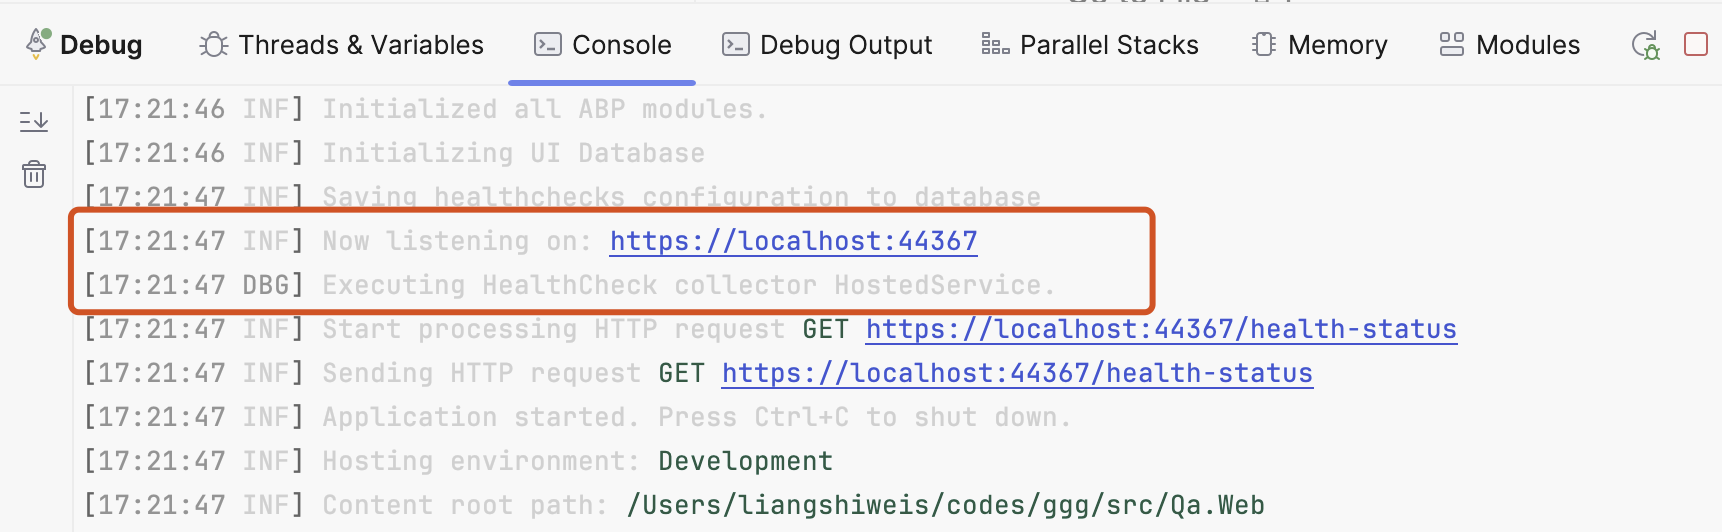
17:21:40 Starting web host17:21:47 Now listening on: https://localhost:44367 -
0
Hi, sorry if I'm bothering you. Are you using a Mac? (In my case I'm working on MacOS on Sonoma silicon M1 Max - RAM 32GB) Application ready after 40 seconds circa. I suspect that can be related to health checks (can I disable them in debug mode?)
Many thanks
-
0
Hi,
Yes, I'm using the MacBook (M1 Pro - RAM 16GB)
I suspect that can be related to health checks (can I disable them in debug mode?)
You can try:
#if !DEBUG ConfigureHealthChecks(context); #endif -
0
Thanks, I will try.
When I start the application without debugging it's really quick, something like few seconds.
-
0
: )
-
0
Bah, I don't understand. Seems I need a weekend of troubleshooting :-) These are the lags on my logs.txt.
`[08:35:15 DBG] AuthenticationScheme: OpenIddict.Validation.AspNetCore was not authenticated. [08:35:21 INF] Executing endpoint 'Health checks'
.........
[08:36:14 WRN] No store type was specified for the decimal property 'AmmontareSingolaBorsa' on entity type 'BorsaStudio'. This will cause values to be silently truncated if they do not fit in the default precision and scale. Explicitly specify the SQL server column type that can accommodate all the values in 'OnModelCreating' using 'HasColumnType', specify precision and scale using 'HasPrecision', or configure a value converter using 'HasConversion'. [08:36:14 WRN] No store type was specified for the decimal property 'QuotaIscrizione' on entity type 'Corso'. This will cause values to be silently truncated if they do not fit in the default precision and scale. Explicitly specify the SQL server column type that can accommodate all the values in 'OnModelCreating' using 'HasColumnType', specify precision and scale using 'HasPrecision', or configure a value converter using 'HasConversion'. [08:36:14 WRN] No store type was specified for the decimal property 'PrezzoCorsoSingolo' on entity type 'ProgrammaDidattico'. This will cause values to be silently truncated if they do not fit in the default precision and scale. Explicitly specify the SQL server column type that can accommodate all the values in 'OnModelCreating' using 'HasColumnType', specify precision and scale using 'HasPrecision', or configure a value converter using 'HasConversion'.
...........
[08:36:28 INF] Completed to save external localizations. [08:36:29 DBG] Added 0 entity changes to the current audit log [08:36:29 INF] Executed endpoint 'Health checks' [08:36:29 INF] Received HTTP response headers after 79361.4253ms - 200 [08:36:29 INF] End processing HTTP request after 79370.3094ms - 200 [08:36:29 INF] Request finished HTTP/1.1 GET https://localhost:44392/health-status - 200 null application/json 78262.5915ms [08:36:29 DBG] HealthReportCollector - health report execution history saved. [08:36:29 DBG] Creating a new HealthReport history. [08:36:29 DBG] HealthReportCollector has completed.`
When I'm starting without debugger some "Request starting HTTP/2 GET https://localhost:44392/ - null null t" are not appearing on the logs.txt.
I will try go check the differences during spare time, I have the same behavior on a Windows Machine with Rider and Visual Studio (I'm on 8.1rc1).
-
0
One more thing (only to track behavior and future reference).
Using the same app from VSCode I noticed this delay here:
[09:35:10 INF] Now listening on: https://localhost:44392 [09:35:10 INF] Application started. Press Ctrl+C to shut down. [09:35:10 INF] Hosting environment: Development [09:35:10 INF] Content root path: /Users/Shared/DEVelopment/nDev/abp8-try/MasterMVC/src/MasterMVC.Web Loaded '/usr/local/share/dotnet/shared/Microsoft.NETCore.App/8.0.3/System.Security.Cryptography.X509Certificates.dll'. Skipped loading symbols. Module is optimized and the debugger option 'Just My Code' is enabled. Loaded '/usr/local/share/dotnet/shared/Microsoft.NETCore.App/8.0.3/System.Threading.Channels.dll'. Skipped loading symbols. Module is optimized and the debugger option 'Just My Code' is enabled. Loaded '/usr/local/share/dotnet/shared/Microsoft.NETCore.App/8.0.3/System.Net.WebSockets.dll'. Skipped loading symbols. Module is optimized and the debugger option 'Just My Code' is enabled. [09:35:10 INF] Request starting HTTP/2 GET https://localhost:44392/ - null null Loaded '/Users/Shared/DEVelopment/nDev/abp8-try/MasterMVC/src/MasterMVC.Web/bin/Debug/net8.0/Microsoft.SqlServer.Server.dll'. Skipped loading symbols. Module is optimized and the debugger option 'Just My Code' is enabled. Loaded '/usr/local/share/dotnet/shared/Microsoft.NETCore.App/8.0.3/System.Runtime.Extensions.dll'. Skipped loading symbols. Module is optimized and the debugger option 'Just My Code' is enabled. Loaded '/usr/local/share/dotnet/shared/Microsoft.NETCore.App/8.0.3/System.Runtime.CompilerServices.Unsafe.dll'. Skipped loading symbols. Module is optimized and the debugger option 'Just My Code' is enabled. [09:35:41 INF] Completed to save external localizations.app is unresponsive till 09:35:41, so it takes 31 secs from the message
[09:35:10 INF] Request starting HTTP/2 GET https://localhost:44392/ - null nullto
[09:35:41 INF] Completed to save external localizations.and in the meantime is loading symbols for sqlserver.dll and other .net core runtime dlls
-
0
When you debug, the IDE takes time to load assembly symbols
and in the meantime is loading symbols for sqlserver.dll and other .net core runtime DLLs
I think this is related to VS code.
